Portfolio
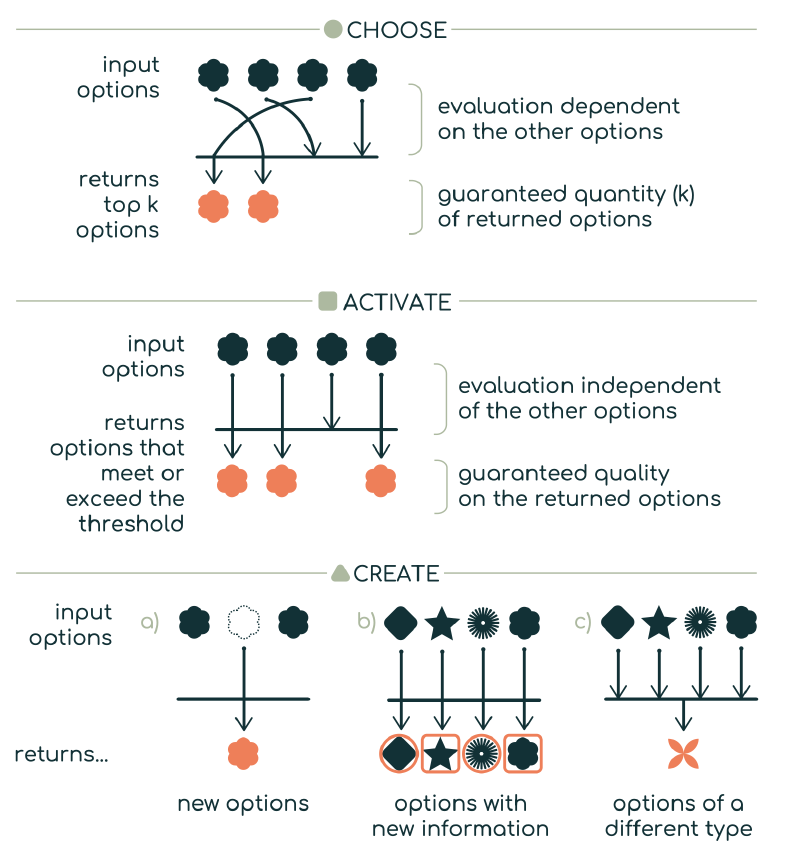
A Typology of Decision-Making Tasks for Visualization
A framework that breaks any decision process into three building blocks (choose, activate, and create), giving designers a shared language to analyze decisions and build visualizations that support them. IEEE VIS 2025.
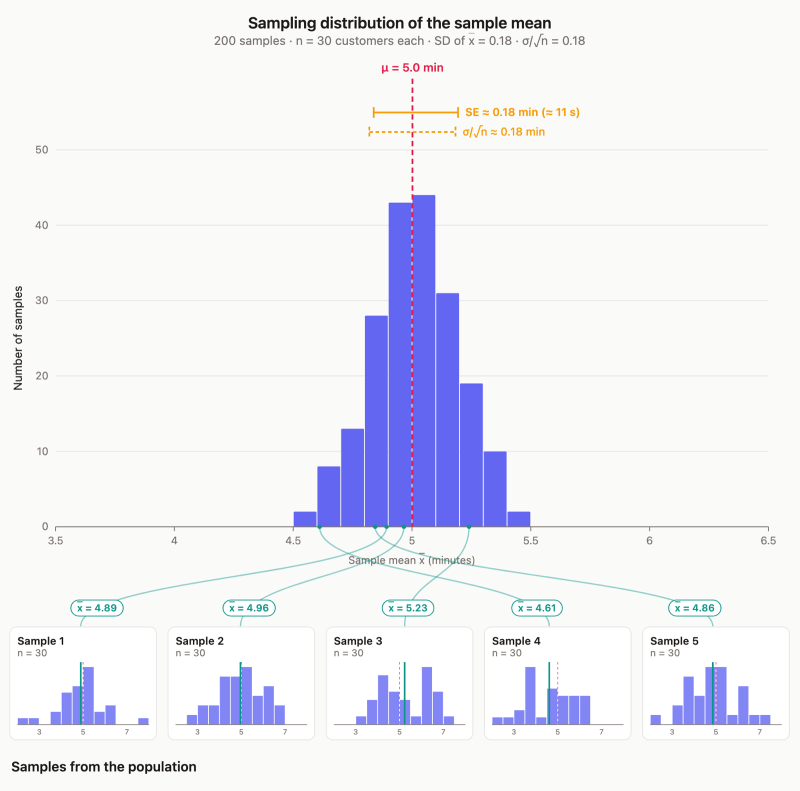
How Much Can You Trust an Average?
An interactive, scroll-driven explainer of the standard error for students new to statistics. Follow a coffee shop’s wait times from a single sample to the sampling distribution of the mean, and see how sample size and the number of samples shape what an average can tell you.